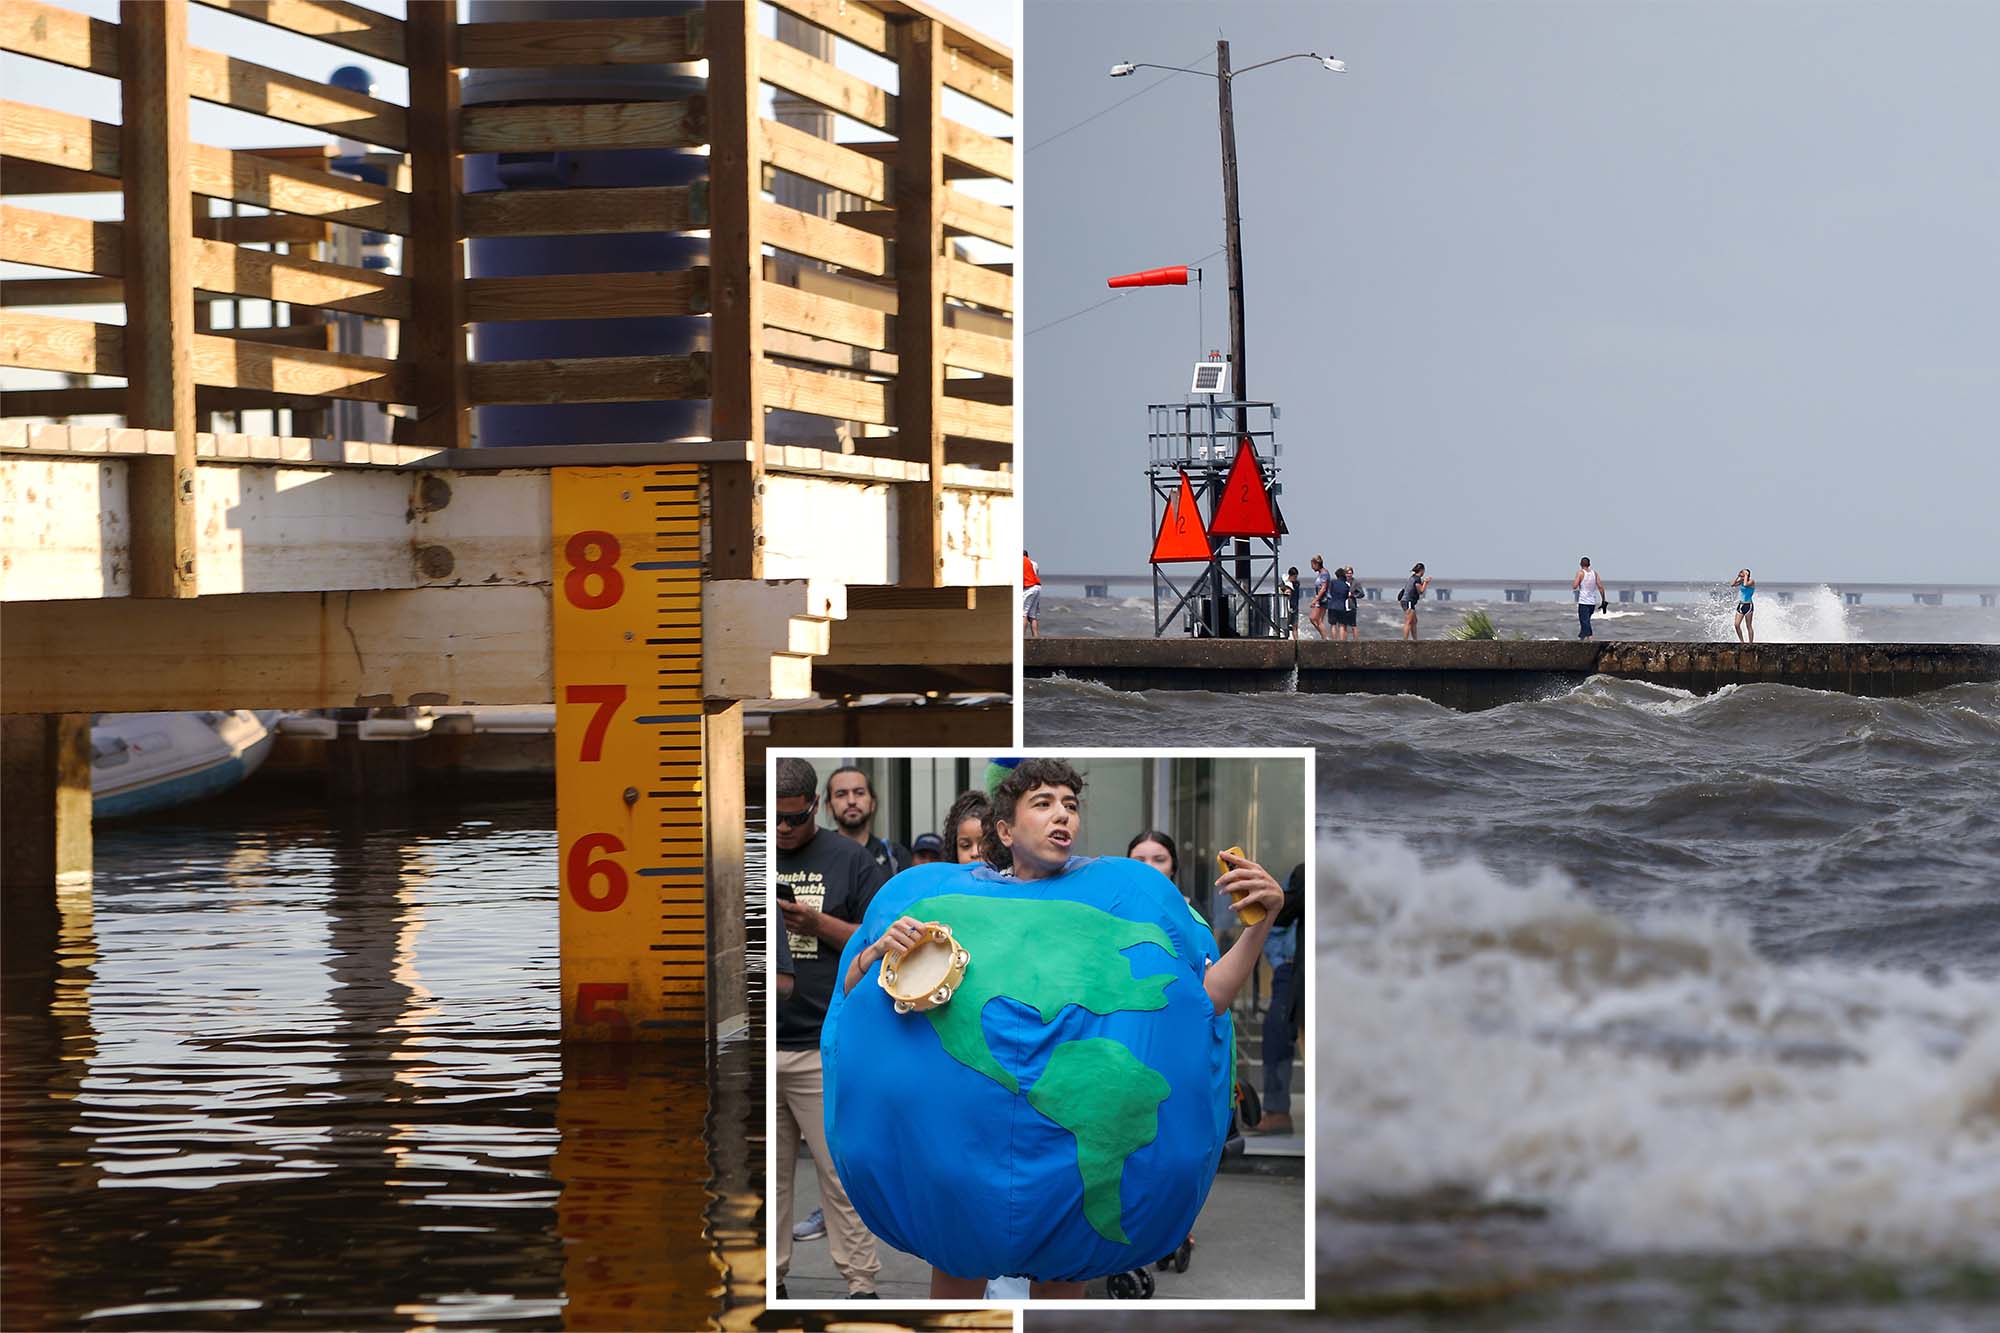
A recent study has revealed that global sea levels are rising at a significantly slower rate than previously predicted, challenging established climate models. The research indicates that the average sea level rise in 2020 was approximately 1.5 mm per year, equivalent to 6 inches per century, according to the findings presented by Dutch engineering consultant Hessel Voortman and independent researcher Rob de Vos.
Voortman expressed surprise that such a comprehensive analysis of real-world local data had not been conducted before. “It is crazy that it had not been done,” he stated in an interview with journalist Michael Shellenberger. He began his research in 2021, focusing on the comparison between projected sea level rises and actual observations, and found no existing studies that filled this gap.
This study is unique in that it was conducted without external funding, a notable point considering Voortman’s extensive experience as a hydraulic engineer involved with flood protection and coastal infrastructure projects worldwide. In a previous paper published in 2023, Voortman claimed that the sea level rise along the low-lying Dutch coast had not accelerated as projected. His current research involved examining data from 200 tide-gauge stations with at least 60 years of records.
Voortman noted that the majority of these stations showed no significant differences between observed and projected sea levels, indicating no detectable acceleration. Most mainstream scientific studies have suggested a rapid increase in sea levels over the past three decades, particularly following the advent of satellite imagery. Voortman’s analysis posits that sea levels were at a “trough” in 1993 and a “peak” in 2020, and that fluctuations in sea levels must be considered to understand trends accurately.
The study also highlighted that the few stations reporting notable rises were often situated near others showing minimal changes, leading to the assertion that these local variations are unlikely to be driven by a global phenomenon such as carbon dioxide-induced climate change. Instead, the research attributed these rises to local factors, including earthquakes, extensive construction activities, or post-glacial adjustments.
According to the study, the models used by the IPCC significantly overestimate local sea level rises for 2020. Voortman emphasized the importance of accurately distinguishing between projections and measurements for practical applications in coastal infrastructure design. “When designing coastal infrastructure, engineers have long accounted for sea level rise. Both measurements and projections are important sources of information,” he stated.
Despite his findings, Voortman clarified that he does not deny the existence of climate change or the value of climate models. “It is important to stress that there are good reasons to have models. If we as engineers design something in the coastal zone, then we try to achieve a technical lifetime of 50 to 100 years, and that means we need to try to look into the future,” he said.
This study invites a critical reevaluation of existing methodologies and assumptions surrounding sea level rise, urging a move towards a more nuanced understanding that incorporates local data and variations.
